
Introduction
For the better part of the 21st century, Africa has been consistently cited as the continent rife with untapped resources. The Democratic Republic of Congo and Botswana, for instance, are considered among the most resource-rich countries in the world largely due to their abundance of diamonds. Likewise, Mozambique and Guinea are huge hubs for Bauxite/Aluminum production. Gold, however, is far and away the most prevalent and precious resource. As far back as 3100 B.C. gold was considered and utilized as a resource for trade (R., 1909). In ancient Greece, gold was an established currency and despite their primitive science at the time, the Greeks mined for gold throughout the Middle East and Mediterranean. Nowadays, gold has become more than a trend; from art to coins to jewelry, gold is found almost everywhere and is axiomatically among the world’s most valuable, non-technological resources today.
Still, the question of whether gold has been a boon or bane is, by no means, trivial. On one hand, the presence of mineral resources such as gold often translates into economic development and by extension, economic growth. Jobs are created that, unlike other alternatives such as agriculture, provide relatively high income, which can, in turn, fund such necessities as education, housing, and healthcare, thereby contributing to improved living standards (Calder, 2014; Hilson, 2016). On the other, a variety of empirical evidence indicates that there is, in fact, a negative relationship between the abundance of natural resources and economic growth in the bulk of African countries (van der Ploeg, 2011). In this paper, we attempt to verify if this remains true. More specifically, we examine if gold-abundant countries in Africa are subject to the infamous “resource curse”.
It should be noted that there have been crucial changes in African countries in regards to their economic, political and environmental climates since the latter half of the 20th century. During the 1990s and early 2000s, many countries were teeming with political unrest, corruption and civil wars. These issues, among many others, were challenges to the governance of the gold-mining sector in these countries that contributed to the sector failing to deliver the benefits to broader society that would be expected from such mineral-rich nations (Elbra, 2017). This study argues that the lack of abject conflict paired with the relatively recent albeit incomplete introduction of better governance factors effectively into economic growth for these African countries.
Literature Review
A large body of research is available that tackles the subject of the resource curse. In 1993, Auty (2002) coined the term as the paradox wherein countries abound in natural resource typically fail to grow as rapidly as those with fewer or no such resources. Ever since, investigations have been conducted and patterns have been documented to substantiate and/or debunk the claim. The results, however, are mixed. The seminal study by Sachs and Warner (1995) demonstrates that natural resources tend to devitalize economic growth. They were able to gather data from 1970 to 1989 and apply cross-section regressions to exhibit that a high rate of natural resource exports was responsible for poor growth rates in their sample of countries. These findings were supported by Gelb (1988), who noted that non-oil countries were better off compared to oil countries in their efficiency of domestic capital formation during economic boom periods. Similarly, Doppelhofer et al. (2000) used a Bayesian approach to test for a “mineral resource curse” and found a significantly negative relationship between per capita GDP and mineral exports. Likewise, Norrbin et al. (2008) and Brückner (2010) explored the hypothesis while adjusting for purchasing power and found a negative relationship as well.
Several theories have been proposed in an effort to answer the question of why there appears to be a negative relationship. The National Resource Governance Institute (2015) identifies several such factors including but not limited to conflict, democracy, and poor management among others. Badeeb et al. (2017) linked two potential lines of reasoning: economic or political. The politics argument points to corruption and institutions as the catalyst of resource mismanagement. The economic position suggests that countries with an abundance of natural resources usually experience issues of lacking economic policy, volatility in the prices of commodities and illiteracy, thereby leading to inefficiencies in utilizing resources. Empirically, a relationship has been established between countries with an abundance of resources and reduced investment in human capital, increased corruption and reductions in economic diversification, which more often than not has led to languishing economic growth (Araji & Mohtadi, 2018). That said, perhaps the most notable rationale for the resource curse that permeates these aforementioned studies is the Dutch Disease phenomenon, which essentially refers to short-term currency appreciation that occurs following good news about an economy. The resulting effect is a decrease in the competitiveness of exports of manufactured goods, as well as an increase in imports. This, in turn, yields a lower net exports value and contributes to the GDP failures we see among the countries.
By contrast, other scholars found no evidence for an adverse relationship between the abundance of natural resources and economic growth (Delacroix, 1977; James, 2015; Lederman & Maloney, 2007). Manzano and Rigobon (2001), for instance, tested the relationship between natural resources and economic growth. They found no evidence of the resource curse and argue that the perceived negative effect of resources on growth can be attributed to the correlation between exports and some unobservable characteristics. In fact, Brunnschweiler and Bulte (2006) disregarded the resource curse as merely a hoax borne out of misinterpretation. They further cite the importance of differentiating between resource abundance and resource dependence – terms that are used interchangeable but are fundamentally distinct – as being a cause for said misinterpretation. Specifically, resource abundance refers to an economy’s available stock of natural resources whereas dependence has to do with a country’s reliance on resources for wealth. They then demonstrated that resource dependence alone is not responsible for growth while abundance has a positive effect on growth. Much the same way, Frankel (2010) argued that resource-rich countries can benefit, referencing the case of Botswana whose economic success is largely due to its mineral sector. Similarly, Bhattacharyya and Hodler (2010) found that mineral resources were advantageous to economies, provided that certain conditions are met, such as the existence of “producer-friendly” firms. A study by Mehlum, Moene, and Torvik (2006) showed similar findings, but also showed a positive correlation between highly dependent natural resource countries and their development failures.
Oddly enough, there was an absence of contemporary studies that analyze the gold and economic growth within the context of the resource curse in Africa, at least to my knowledge. Of the research that exists, only a handful show some semblance of significance, but in most cases, an argument can be made for correlation as opposed to causation. While establishing causation is arduous, ascertaining correlation would undoubtedly shed light on the issue of gold in Africa being a resource curse, as well as contribute to the general body of work surrounding the resource curse. That is, a correlation, be it positive or negative between gold and economic growth would imply a relationship between the two concepts, thereby filling any gaps about whether the resource curse exists, and perhaps speak to the extent of its effect.
Data and Empirical Specifications
The following section describes the data and data sources used in this study. Since the primary focus of this study was to investigate the relationship between two economic factors, finding data was not difficult. In this case, the data was collected from the World Bank, the Observatory of Economic Complexity (OEC), the World Health Organization (WHO) and the United States Bureau of Labor Statistics. The data collected were from 2005 to 2015 and spanned a total of 10 African countries, as shown in Table 1.
Since the data available was in raw format, it was imperative to clean it by eliminating any duplicate rows, null values and outliers. To do so, a custom function in Python was used to find any such rows and then data imputation was used; for columns with fewer outliers, the mean of the remaining values was imputed whereas for columns with multiple outliers, the median of the remaining values was imputed.
The dependent variable is the gold exports. For the independent variables, however, there were several possible choices. Utilizing each and every variable available would over-parameterize the regression model and potentially lead to regression-specific errors such as multicollinearity. To obviate any such issues, only a handful of control variables were considered appropriate based on real-world economic intuition and evidence from other similar studies. The resulting choice of variables are depicted in Table 2.
The variables are also illustrated in Table 3, along with their respective descriptive statistics. There was a total of 87 observations in the dataset.
The regression models are as follows:
Simple linear regression:
gdp=β0+β1goldexp+ϵ
Multiple regression:
gdp=β0+β1goldexp+β2hdi+ β3lfpr+β4educ+β5capit+β6unemp+η
Adjusted multiple regression (quadratic effect):
gdp=β0+β1goldexp+β2(goldexp)2+β3hdi+ β4lfpr+β5educ+β6capit+β7unemp+ υ
Before any regression is attempted, however, the regression assumptions must first be addressed:
-
Linear relationship. The functional form of our regression is This has been satisfied by design.
-
No multicollinearity. None of the predictor variables should highly correlated. To determine if this condition has been met, consider the associated correlation diagram (Table 4). While the variables are all somewhat correlated, most are poorly correlated, and none surpasses an absolute value of 0.6. Equivalently, consider the VIF results in Table 5, which all have VIF values below in the (1, 10) range; in contemporary econometrics, a VIF value of between 1 to 10 indicates no issues of multicollinearity, with a VIF of 3 being ideal. In either case, the values don’t seem to be highly correlated therefore, this assumption is satisfied.
-
Independence and no autocorrelation among residuals. Essentially, the regression assumes that the data used is random and unbiased. The safe assumption can be made that data collected by the organizations above is complete and unbiased. Alternatively, one may consider applying a Durbin-Watson test for autocorrelation, which would promptly show a significant test statistic and a sufficiently high p-value such that the null hypothesis of there being no autocorrelation is not rejected.
-
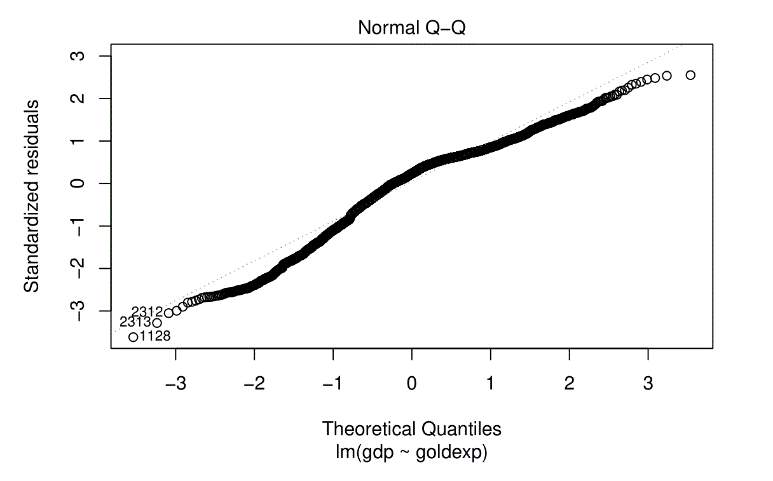
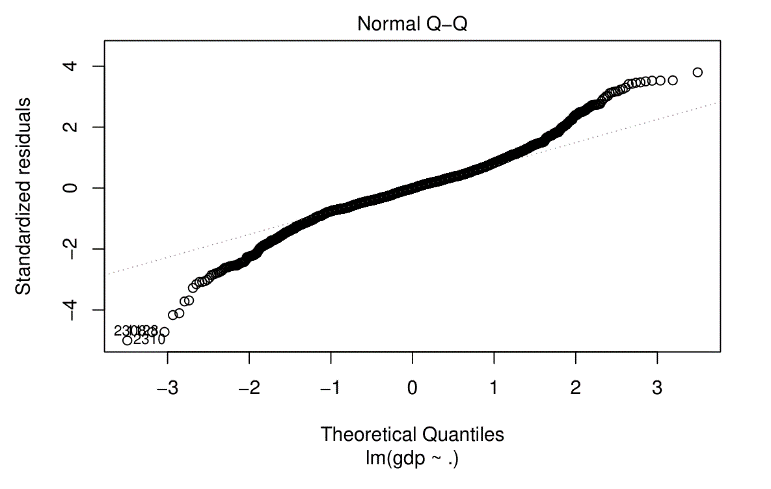
Normality. The residuals should be normally distributed, which can be verified visually using their Quantile-Quantile (QQ) plots (Figures 1-3). Evidently, the residuals appear to have a linear behavior, with some expected discrepancies, which are likely minor faults with data collection. We may therefore assume that the residuals approximately follow a normal distribution.
-
Homoskedasticity. Homoskedasticity – the variance of residuals being constant as opposed to increasing – is important because it leads to the Best Linear Unbiased Estimators (BLUE) and failure to account for this can lead to biased or skewed results. Of course, some heteroskedasticity will be present due to the nature of the data being investigated, however, this doesn’t automatically indicate imprecision. Rather, the large enough sample size and small variance of the estimates can account for any minor discrepancies and produce sufficiently accurate estimates. We therefore assume that this has been satisfied in the models.


_model.png)
Thus, all the Gauss-Markov assumptions have been satisfied, which now allows us to perform regression.
Empirical Results
Each model was estimated independently, and the results are displayed in Table 6. The equations are as follows:
Simple linear regression:
gdp=43.544+3.759goldexp
Multiple regression:
gdp=68.383+2.541 goldexp+0.176 hdi+ −1.252 lfpr+0.605 educ+0.747 capit−0.072 unemp
Adjusted multiple regression:
gdp=−121.126+2.575 goldexp−0.009 (goldexp)2+0.288 hdi−1.513 lfpr+0.630 educ+0.735 capit−0.089 unemp
Most of the variables in the multiple regressions were significant to a good degree, however, the most notable were goldexp, educ and unemp. Notice that our variable of interest, goldexp, has a positive coefficient and is statistically significant in all three cases. That is, a one-unit change in goldexp corresponds to a 3.759, 2.541 and 2.575 change in gdp based on each regression respectively. The positive correlation and significance could be because exports are a strong component in GDP for any given country. Regardless, this is a fascinating result as it implies that the resource curse is not necessarily present in the African gold industry. Moreover, the third model that tested for a quadratic relationship showed that (goldexp)2 is has a negative coefficient estimate and is significant at the 1% level. It follows that GDP per capita increases as gold exports increase but at higher levels of exports, the GDP per capita increases at a slower rate. Still, the coefficient of (goldexp)2 has a small magnitude, suggesting that the quadratic effect isn’t pronounced.
The corresponding R-squared values for each regression is 0.3852, 0.7784 and 0.8188, thus indicating that 38.52%, 77.84% and 81.88% of the data can be explained by the regression models respectively. It is noteworthy that 38.52% is not a very high R-squared value but is expected of a simple regression model and reinforces the need to have additional explanatory variables. By contrast, the 77.84 and 81.88% are sufficiently high and expected of any good multiple regression model.
Conclusion
The analysis conducted in this study shows that the gold exports are proportional to GDP per capita, regardless of whether the ceteris paribus assumption is taken into consideration. It was found that in all cases, the coefficient for gold exports was relatively high and positive, indicating a positive relationship. That is, a given percentage increase in gold exports will lead to a percentage increase in GDP per capita while a given percentage decrease will result in a percentage decrease in GDP per capita. This finding remains statistically significant despite the addition of explanatory variables. For the purposes of statistical inference, a T-test and F-test were performed. For the former, the usual null hypothesis for coefficient significance was tested against a two-sided alternative. The p-value was infinitesimal and the null was rejected in favor of the alternative that the coefficient is, in fact, significant. The same was observed with the other predictors, which showed that all of them were well-suited to the model. An F-test was performed to analyze joint significance and the resulting p-value was likewise infinitesimal. Once again, the null hypothesis is rejected, implying that the variables are jointly significant and should be included in the regression model. Hence, the inference can be made that the resource curse did not take place with gold during the 2005-2015 period. The advancement of technology, reduction in unrest, and better management are likely some of the catalysts that may have led to better resource allocation, and thus economic growth.
While the results above are based on rigorous analysis, there are some limitations. To begin with, while precautions were taken to eschew statistical oversight and utilize only the best variables, a different choice of variables may have indicated a negative relationship. While any such scenario doesn’t necessarily affect the simple regression, it could put into question the significance of the effect of gold exports on GDP per capita. Alternatively, other studies that have found evidence of the resource curse had used different variables; Mutize and Motlhabane (2021), for example, used income, rent and population among others, and their fixed estimation model evinced the existence of a resource curse. Another potential limitation to this study is the application of only two models and methods. Alternative regression models such as the Two-Stage-Least-Squares (2SLS) or a Logit model may have exhibited different results. One might also benefit from performing a robustness test to ensure that the results shown above hold in other situations. Finally, this study only accounts for a handful of countries in a 10-year period with 87 observations, which would ordinarily be considered a sufficient sample and sample size. However, a case can be made for the economic impact of, say, the recent Covid-19 pandemic leading to the resource curse thereby bring into question the applicability of this study to present-day Africa. Alternatively, a larger sample size of countries would yield results that can better explain trends in the entire country of Africa, as the resource curse likely spans the continent as a whole. As for the size, sample sizes being made as large as possible, more often than not, generate more accurate results. Fortunately, some of the other studies have shown similar findings, which suggests that the methodology used in this paper was reasonable, and that there is some credence to our conclusions.
This analysis also has policy implications for governments and policymakers alike. It is patently clear that African institutions are have far to go to catch up with the Western world. Despite the drawbacks that followed colonialism and the great divergence, the results above indicate that the continent has made some headway. Presently, natural resources are believed to be a bane for Africa in that they are losing out on precious resources under the guise of profits. Given the global shift towards technology and alternative currencies, gold revenues are considered unsustainable and uncertain, which spells disaster for Africa. However, the analyses above reveal that African economies are becoming adequately prepared to handle drastic change through better management of these resources. The profits they receive from gold and other natural resources serve as a boon, as they boost investments, employment and GDP. However, any semblance of progress necessitates dramatic change.
Given that one of their primary goals is achieving economic growth and development, governments and local policymakers of resource-rich countries should carefully appraise their gold mining, management, and allocation processes and establishments to ascertain good performance. Privatization, for instance, may be an appropriate measure as private proprietors are often better equipped to maximize potential and minimize errors. Several studies have found that incentives play a significant role in the economic efficiency and that privatization, even partial privatization, can be beneficial to economic growth (Parker & Kirkpatrick, 2005; Plane, 1997; Yu & Lai, 2020). Investment in training and capital, as well as research and development, could also serve to optimize their gold mining establishments. Governments must realize the importance of a powerful labor force and be able to develop their citizens’ education such that they can better make use of resources in wealth creation. After all, human capital is considered among the best greatest resources and wealth of nations, which, in turn, manages other resources in a pursuit for long term growth (Harbison, 1971). It is also recommended that governments strive to improve transparency, accountability and encourage better governance in gold management to both improve quality and stifle instances of corruption. Ideally, it is suggested that governments follow the sustainability rule by Hartwick (1977), which prescribes a reinvestment of resource profits to keep the value of net investments at zero. Specifically, it advises that governments “invest profits from exhaustible resources in reproducible capital such as machines […] to solve the ethical problem of the current generation shortchanging future generations by overconsuming the current product.” Essentially, keeping all capital constant balances depreciation with investment, ergo prompting a constant level of consumption and GDP. After all, it was this very notion that allowed Botswana to avoid the Dutch Disease by maintaining their budget and a surplus in trade, albeit focusing on diamond mining. Nevertheless, these results are reproducible with gold and would no doubt be beneficial to countries facing negative GDP outcomes despite resource abundance.
Further study is certainly encouraged. For further research, one might consider examining other aspects related to the resource curse in Africa. “Is there a resource curse present in the textiles industry in Africa?”, “To what extent is education a prominent factor in gold-mining in Africa?”, and “How can the resource curse in Africa – if it exists – be mitigated?” are just some of the plausible studies that might be considered beneficial following this study.